Monitoring NGINX with Prometheus
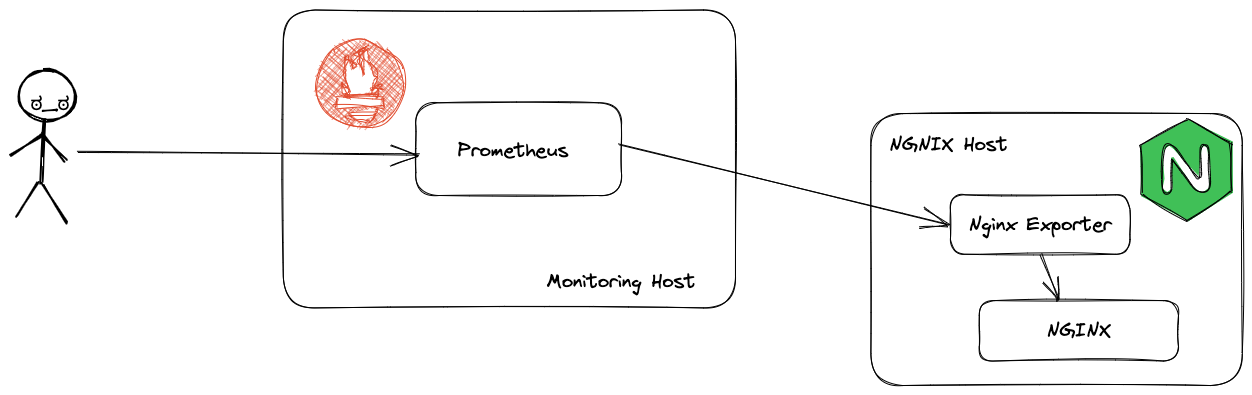
Using the NGINX Prometheus exporter to add MGINX metrics into Prometheus.
NGINX Prometheus exporter fetches the metrics from a single NGINX or NGINX Plus, converts the metrics into appropriate Prometheus metrics types and finally exposes them via an HTTP server to be collected by Prometheus.
These instructions assume you already have a running Prometheus server - see here for an example.
Installing NGINX and exposing metrics
Using a Ubuntu host
1sudo apt install nginx
Update the configuration to exposed the Basic Status page sudo vi /etc/nginx/sites-enabled/default
and add
1      location /nginx_status {
2        stub_status;
3        allow 127.0.0.1;        #only allow requests from localhost
4        deny all;               #deny all other hosts
5      }
and restart nginx sudo systemctl restart nginx
The metrics should now be available with curl
1root@nginx:/etc/nginx/sites-enabled# curl localhost/nginx_status
2Active connections: 1
3server accepts handled requests
4 2 2 2
5Reading: 0 Writing: 1 Waiting: 0
Running the Node exporter
Set the required version and architecture (arm64 or amd64)
1export VERSION=0.11.0
2export ARCH=arm64
Create a user
1useradd -M -r -s /bin/false nginx_exporter
Download and install the binary
1wget https://github.com/nginxinc/nginx-prometheus-exporter/releases/download/v$VERSION/nginx-prometheus-exporter_${VERSION}_linux_$ARCH.tar.gz
2tar xvfz nginx-prometheus-exporter_${VERSION}_linux_${ARCH}.tar.gz
3
4cp nginx-prometheus-exporter /usr/local/bin/
5chown nginx_exporter:nginx_exporter /usr/local/bin/nginx-prometheus-exporter
Create a SystemD service for the nginx_exporter
 1cat > /etc/systemd/system/nginx_exporter.service <<EOF
 2[Unit]
 3Description=Prometheus Nginx Exporter
 4Wants=network-online.target
 5After=network-online.target
 6
 7[Service]
 8User=nginx_exporter
 9Group=nginx_exporter
10Type=simple
11ExecStart=/usr/local/bin/nginx-prometheus-exporter -nginx.scrape-uri=http://localhost/nginx_status
12
13[Install]
14WantedBy=multi-user.target
15EOF
16
17systemctl daemon-reload
18systemctl start nginx_exporter
19systemctl enable nginx_exporter
The exporter should now be exposing metrics
 1root@nginx:/etc/nginx/sites-enabled# curl localhost:9113/metrics
 2# HELP nginx_connections_accepted Accepted client connections
 3# TYPE nginx_connections_accepted counter
 4nginx_connections_accepted 3
 5# HELP nginx_connections_active Active client connections
 6# TYPE nginx_connections_active gauge
 7nginx_connections_active 1
 8# HELP nginx_connections_handled Handled client connections
 9# TYPE nginx_connections_handled counter
10nginx_connections_handled 3
11# HELP nginx_connections_reading Connections where NGINX is reading the request header
12# TYPE nginx_connections_reading gauge
13nginx_connections_reading 0
14# HELP nginx_connections_waiting Idle client connections
15# TYPE nginx_connections_waiting gauge
16nginx_connections_waiting 0
17# HELP nginx_connections_writing Connections where NGINX is writing the response back to the client
18# TYPE nginx_connections_writing gauge
19nginx_connections_writing 1
20# HELP nginx_http_requests_total Total http requests
21# TYPE nginx_http_requests_total counter
22nginx_http_requests_total 4
23# HELP nginx_up Status of the last metric scrape
24# TYPE nginx_up gauge
25nginx_up 1
26# HELP nginxexporter_build_info Exporter build information
27# TYPE nginxexporter_build_info gauge
28nginxexporter_build_info{arch="linux/arm64",commit="e4a6810d4f0b776f7fde37fea1d84e4c7284b72a",date="2022-09-07T21:09:51Z",dirty="false",go="go1.19",version="0.11.0"} 1
On the Prometheus host edit the file /etc/prometheus/prometheus.yml and add a new job in the required section
1 - job_name: 'NGINX Server'
2  static_configs:
3  - targets: ['<IP_ADDRESS_OF_NGINX_SERVER>:9113']
and restart Prometheus sudo systemctl restart prometheus
The NGINX metrics should now start to appear in Prometheus