Installing Prometheus
Prometheus is an open-source systems monitoring and alerting toolkit originally built at SoundCloud. It has been used by many companies for over 10 years and forms the foundation of a good and flexiable monitoring system
In this the first of a series of posts we will go back to the basics installing Prometheus and node exporter on either VM's or Bare-metal hosts. In later posts the installation on Kubernetes will be covered.
Requirements: To complete this you will need at least one, preferably two virtual machines running Ubuntu 22.04. The instructions will work on other operating systems but it has not been tested.
Installation of the Prometheus Server
These instructions can be downloaded as a single script
Set the required version and architecture (arm64 or amd64)
1export VERSION=2.18.0
2export ARCH=arm64
Create a user to run Prometheus and create the required directories
1useradd -M -r -s /bin/false prometheus
2mkdir /etc/prometheus /var/lib/prometheus
Download and install the binaries
1wget https://github.com/prometheus/prometheus/releases/download/v$VERSION/prometheus-$VERSION.linux-$ARCH.tar.gz
2tar xzf prometheus-$VERSION.linux-$ARCH.tar.gz prometheus-$VERSION.linux-$ARCH/
3
4cp prometheus-$VERSION.linux-$ARCH/{prometheus,promtool} /usr/local/bin/
5chown prometheus:prometheus /usr/local/bin/{prometheus,promtool}
Copy the default setup files from the download
1cp -r prometheus-$VERSION.linux-$ARCH/{consoles,console_libraries} /etc/prometheus/
2cp prometheus-$VERSION.linux-$ARCH/prometheus.yml /etc/prometheus/prometheus.yml
3
4chown -R prometheus:prometheus /etc/prometheus
5chown prometheus:prometheus /var/lib/prometheus
Create a SystemD service file for Prometheus and Start the process
 1cat > /etc/systemd/system/prometheus.service <<EOF
 2[Unit]
 3Description=Prometheus Time Series Collection and Processing Server
 4Wants=network-online.target
 5After=network-online.target
 6[Service]
 7User=prometheus
 8Group=prometheus
 9Type=simple
10ExecStart=/usr/local/bin/prometheus \
11 --config.file /etc/prometheus/prometheus.yml \
12 --storage.tsdb.path /var/lib/prometheus/ \
13 --web.console.templates=/etc/prometheus/consoles \
14 --web.console.libraries=/etc/prometheus/console_libraries
15[Install]
16WantedBy=multi-user.target
17EOF
18
19systemctl daemon-reload
20systemctl start prometheus
21systemctl enable prometheus
If everything has worked ok you should now be able to curl Prometheus and get a response
1curl localhost:9090
The UI should also be available on http:<server-ip>:9090
If the above fail check the output of systemctl status prometheus and journalctl -u prometheus
Installation of the Node Exporter
This can be installed on the same host as Prometheus but if possible on a separate host.
These instructions can be downloaded as a single script
Set the required version and architecture (arm64 or amd64)
1export VERSION=1.5.0
2export ARCH=arm64
Create a user
1useradd -M -r -s /bin/false node_exporter
Download and install the binary
1wget https://github.com/prometheus/node_exporter/releases/download/v$VERSION/node_exporter-$VERSION.linux-$ARCH.tar.gz
2tar xvfz node_exporter-$VERSION.linux-$ARCH.tar.gz
3
4cp node_exporter-$VERSION.linux-$ARCH/node_exporter /usr/local/bin/
5chown node_exporter:node_exporter /usr/local/bin/node_exporter
Create a SystemD service for the node_exporter
 1cat > /etc/systemd/system/node_exporter.service <<EOF
 2[Unit]
 3Description=Prometheus Node Exporter
 4Wants=network-online.target
 5After=network-online.target
 6
 7[Service]
 8User=node_exporter
 9Group=node_exporter
10Type=simple
11ExecStart=/usr/local/bin/node_exporter
12
13[Install]
14WantedBy=multi-user.target
15EOF
16
17systemctl daemon-reload
18systemctl start node_exporter
19systemctl enable node_exporter
The node exporter should respond on port 9100
1curl localhost:9100/metrics
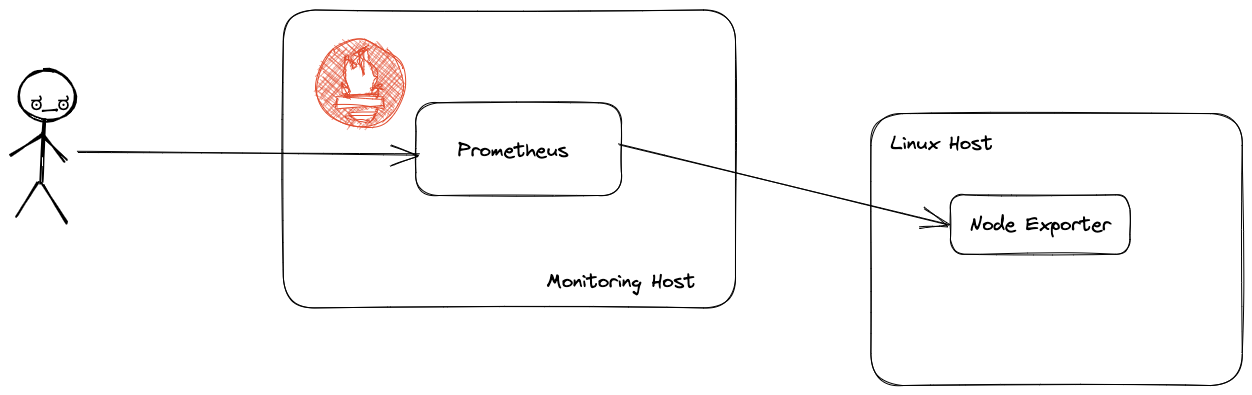
Now the Prometheus configuration needs to be updated to scrape the node exporter configuration. Prometheus works on a pull model so it will pull all the metrics from end-points rather than having the metrics pushed to it.
On the Prometheus host edit the file /etc/prometheus/prometheus.yml and add a new job in the required section
1 - job_name: 'Test Server'
2  static_configs:
3  - targets: ['<IP_ADDRESS_OF_TEST_SERVER>:9100']
To allow Prometheus to pick up the new config either by restarting the service systemctl restart prometheus or by sending a HUP to the process killall -HUP prometheus
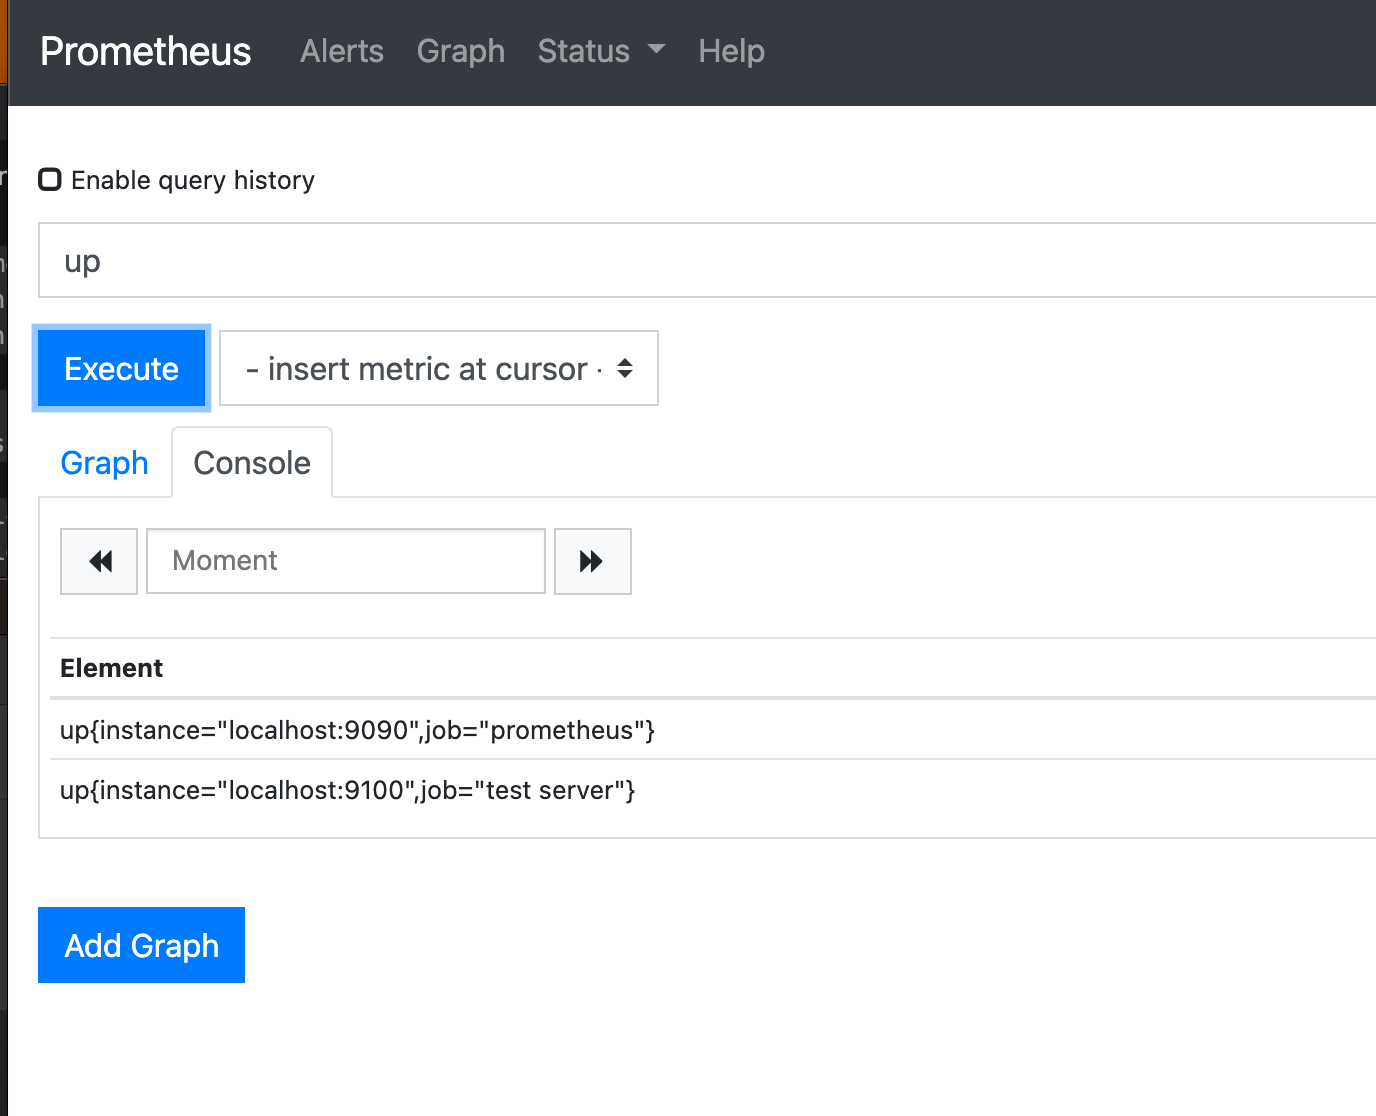
Prometheus will now be picking up metrics from the node exporter. To test enter the expression up in the UI and press execute. It should return 2 jobs.