Prometheus Alert Manager
The Prometheus Alertmanager handles alerts sent by client applications such as the Prometheus server. It takes care of deduplicating, grouping, and routing them to the correct receiver integration such as email, PagerDuty, or OpsGenie. It also takes care of silencing and inhibition of alerts.
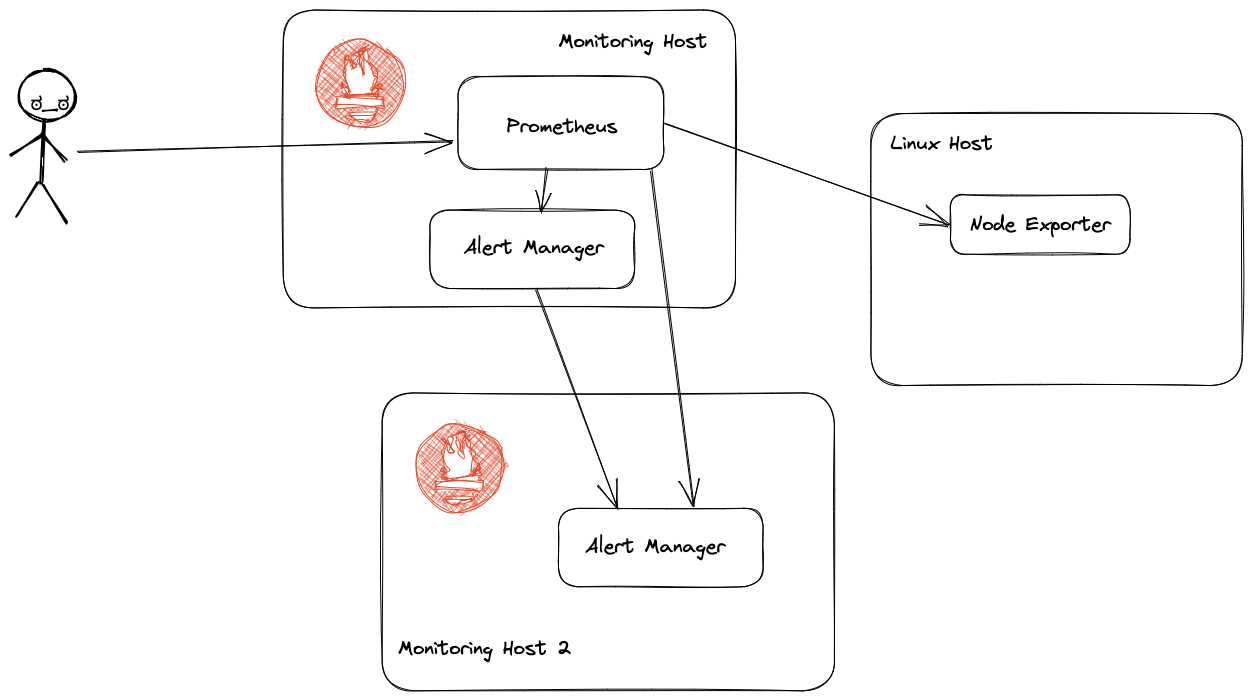
To ensure that alert messages get delivered it's a good idea to run several alertmanager processes clustered together, so in this example we will deploy 2 on different machines
These instructions assume you already have a running Prometheus server - see here for an example.
Installing Alert Manager
Initially this will be done on the existing Prometheus server, these instructions can also be downloaded as a install script
Set the required versions
1export VERSION=0.25.0
2export ARCH=arm64
and create a user to run the process under
1useradd -M -r -s /bin/false alertmanager
Download the binaries and install it in /usr/local/bin
1wget https://github.com/prometheus/alertmanager/releases/download/v$VERSION/alertmanager-$VERSION.linux-$ARCH.tar.gz
2tar xvfz alertmanager-$VERSION.linux-$ARCH.tar.gz
3
4cp alertmanager-$VERSION.linux-$ARCH/{alertmanager,amtool} /usr/local/bin/
5chown alertmanager:alertmanager /usr/local/bin/{alertmanager,amtool}
Copy the sample config files and create the config file for amtool
 1mkdir -p /etc/alertmanager
 2cp alertmanager-$VERSION.linux-$ARCH/alertmanager.yml /etc/alertmanager
 3chown -R alertmanager:alertmanager /etc/alertmanager
 4mkdir -p /var/lib/alertmanager
 5chown alertmanager:alertmanager /var/lib/alertmanager
 6mkdir -p /etc/amtool
 7
 8cat > /etc/amtool/config.yml <<EOF
 9alertmanager.url: http://localhost:9093
10EOF
Create and start the systemd process to run alertmanager
 1
 2cat > /etc/systemd/system/alertmanager.service <<EOF
 3[Unit]
 4Description=Prometheus Alertmanager
 5Wants=network-online.target
 6After=network-online.target
 7[Service]
 8User=alertmanager
 9Group=alertmanager
10Type=simple
11ExecStart=/usr/local/bin/alertmanager \
12 --config.file /etc/alertmanager/alertmanager.yml \
13 --storage.path /var/lib/alertmanager/
14[Install]
15WantedBy=multi-user.target
16EOF
17
18systemctl enable alertmanager
19systemctl start alertmanager
Use amtool to check the configuration
 1neilarmitage@prom1:~/prometheus$ amtool config show
 2global:
 3  resolve_timeout: 5m
 4  http_config:
 5    follow_redirects: true
 6    enable_http2: true
 7  smtp_hello: localhost
 8  smtp_require_tls: true
 9  pagerduty_url: https://events.pagerduty.com/v2/enqueue
10  opsgenie_api_url: https://api.opsgenie.com/
11  wechat_api_url: https://qyapi.weixin.qq.com/cgi-bin/
12  victorops_api_url: https://alert.victorops.com/integrations/generic/20131114/alert/
13  telegram_api_url: https://api.telegram.org
14  webex_api_url: https://webexapis.com/v1/messages
15route:
16  receiver: web.hook
17  group_by:
18  - alertname
19  continue: false
20  group_wait: 30s
21  group_interval: 5m
22  repeat_interval: 1h
23inhibit_rules:
24- source_match:
25    severity: critical
26  target_match:
27    severity: warning
28  equal:
29  - alertname
30  - dev
31  - instance
32receivers:
33- name: web.hook
34  webhook_configs:
35  - send_resolved: true
36    http_config:
37      follow_redirects: true
38      enable_http2: true
39    url: http://127.0.0.1:5001/
40    max_alerts: 0
41templates: []
Now Prometheus needs to know about the alertmanager so edit vi /etc/prometheus/prometheus.yml and add
1alerting:
2 alertmanagers:
3 - static_configs:
4 - targets: ["localhost:9093"]
and then restart Prometheus sudo systemctl restart prometheus
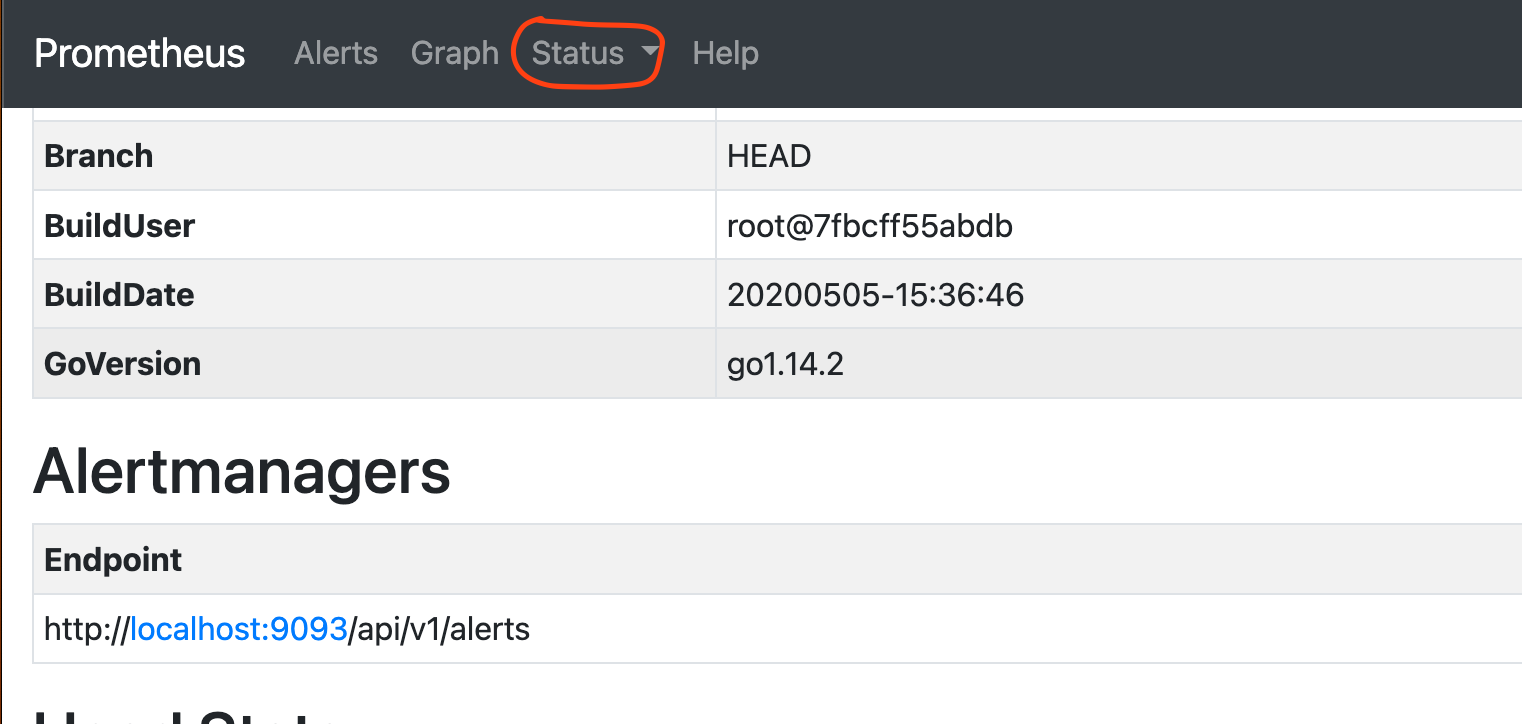
The new alertmanager should now show up under the status tab in Prometheus
Adding a second Alert Manager Instance
To ensure Alerts get delivered a second instance of Alert Manager is recommended. The setup of the Alert Manager on a separate host is the same as the initial setup with the exception of a addition command option on the startup of Alert Manager so it knows where the other host is --cluster.peer=
 1[Unit]
 2Description=Prometheus Alertmanager
 3Wants=network-online.target
 4After=network-online.target
 5
 6[Service]
 7User=alertmanager
 8Group=alertmanager
 9Type=simple
10ExecStart=/usr/local/bin/alertmanager \
11 --config.file /etc/alertmanager/alertmanager.yml \
12 --storage.path /var/lib/alertmanager/ \
13 --cluster.peer=<IP of first alertmanager>:9094
14
15[Install]
16WantedBy=multi-user.target
Once the second instance is running update the Systemd file on the first alert manager to add the --cluster.peer=<ip of 2nd host>:9094 The reload the config and restart the service
1sudo systemctl daemon-reload
2sudo systemctl restart alertsudomanager
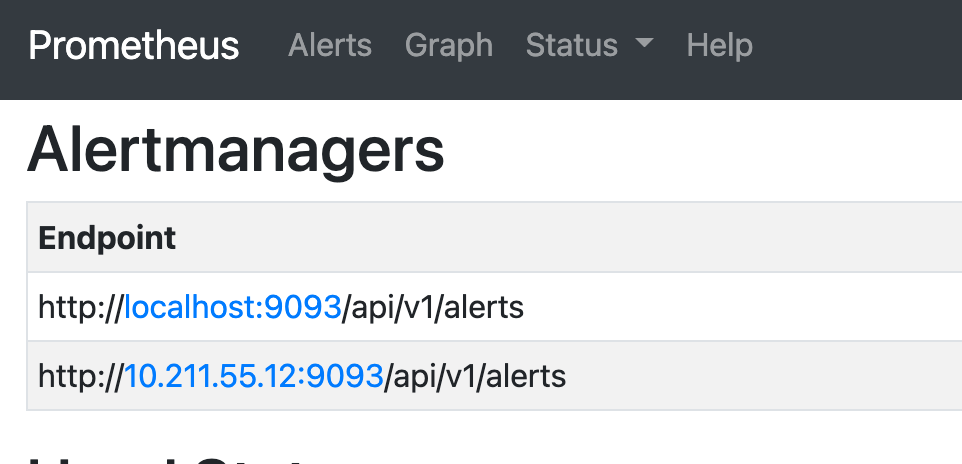
Now Prometheus needs to know about the second alertmanager so edit vi /etc/prometheus/prometheus.yml and add
1alerting:
2 alertmanagers:
3 - static_configs:
4 - targets: ["localhost:9093","IP of 2nd alertmanager:9093]
and then restart Prometheus sudo systemctl restart prometheus
The new alertmanager should now show up under the status tab in Prometheus
Writing Alerts
First of all edit sudo vi /etc/prometheus/prometheus.yml and update the rules_files option to add a rules directory, this will allow us to create multiple files in this directory without having to further update the config.
1rule_files:
2- "/etc/prometheus/rules/*.yml"
Create the rules file directory
1sudo mkdir /etc/prometheus/rules/
2sudo chown prometheus:prometheus /etc/prometheus/rules/
Now we can create a test rule sudo vi /etc/prometheus/rules/test.yml
1groups:
2- name: test-server
3  rules:
4  - alert: TestServerDown
5    expr: up{job="test server"}==0
6    labels:
7      severity: critical
8    annotations:
9      summary: Test Server Down
Now restart Prometheus to pick up the change sudo systemctl restart prometheus
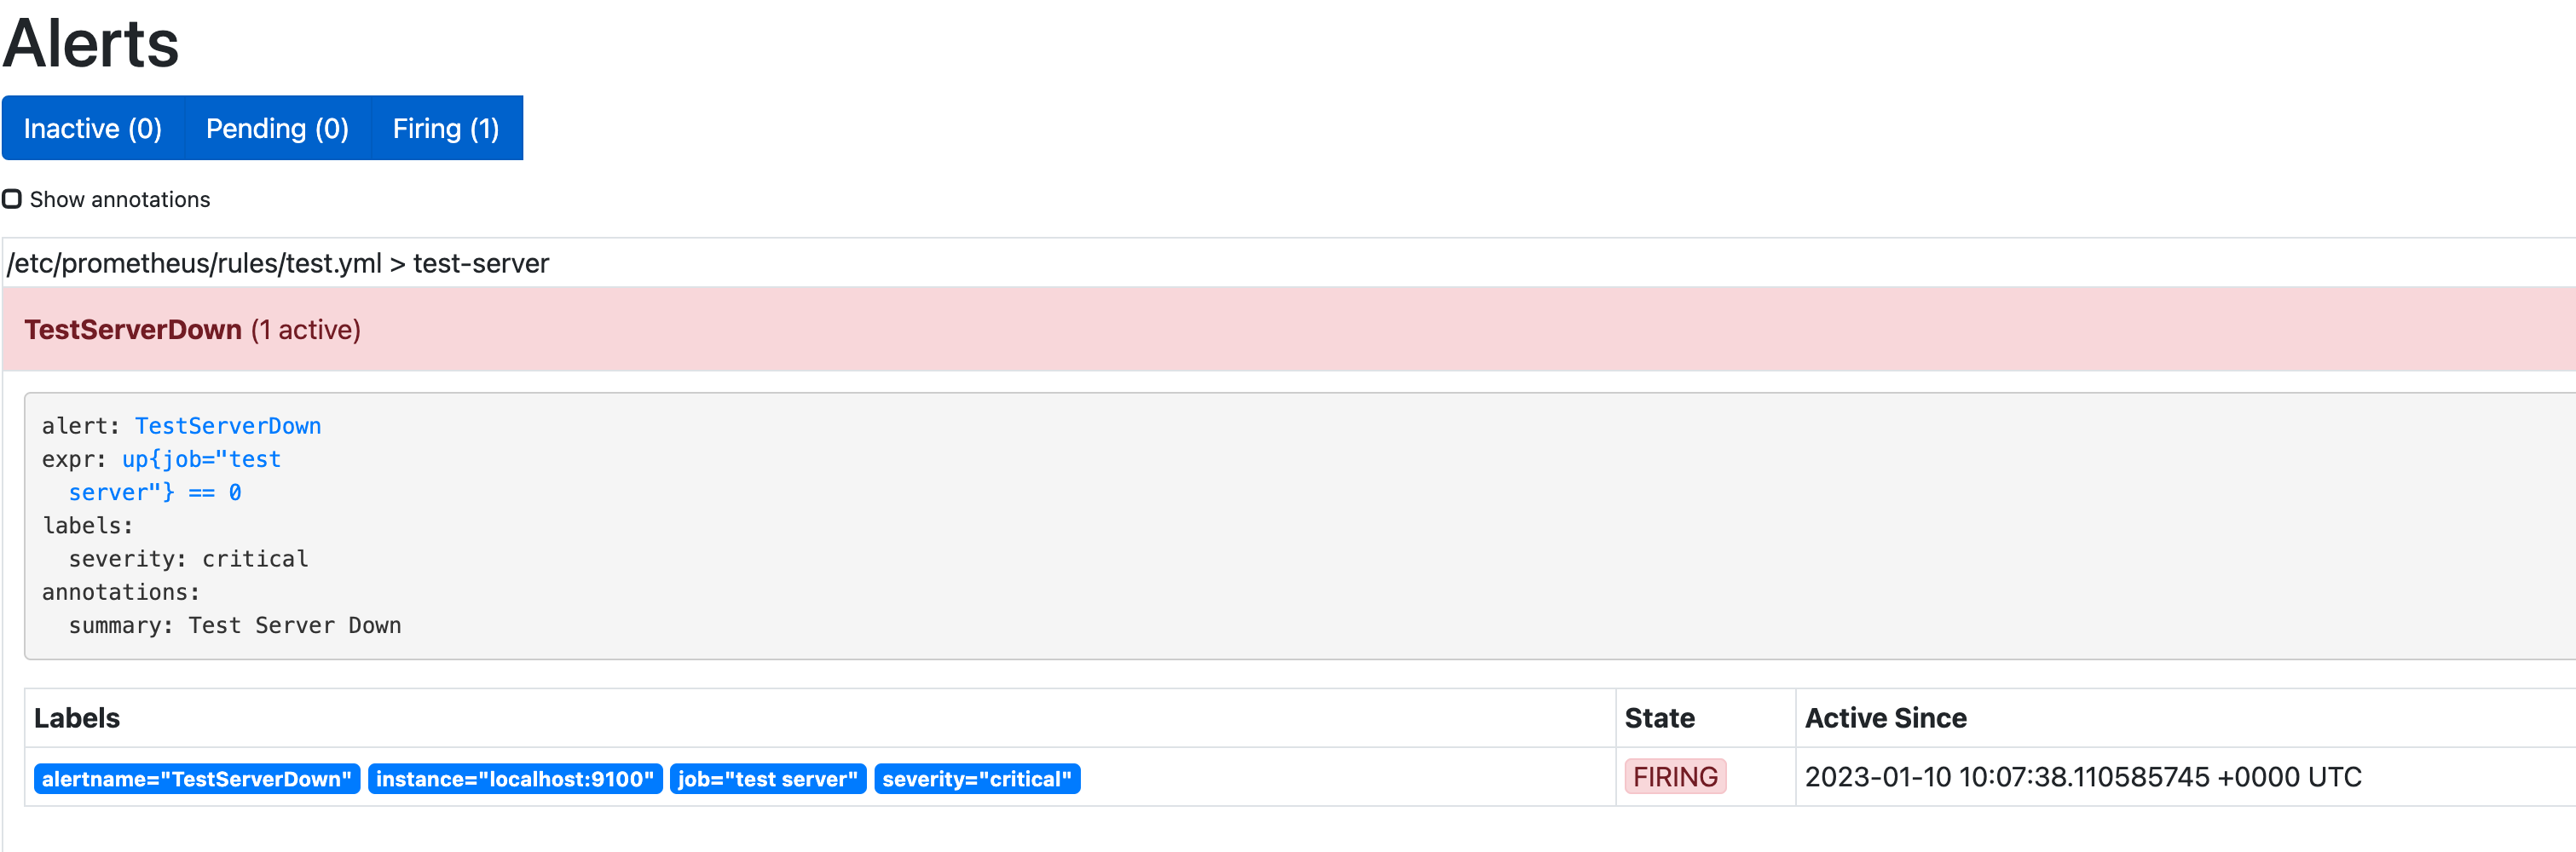
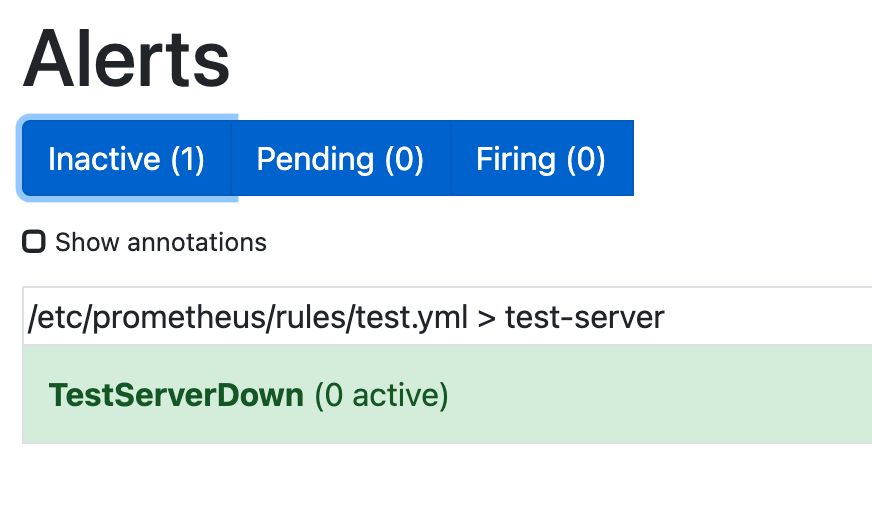
The Alert should now show on the UI as Inactive
If you stop the node_exporter on the test server sudo systemctl stop node_exporter and wait a minute the alert should show as active